Impact of gas drilling on Natura 2000-areas in Groningen
using Web Services in ArcGIS 10
Introduction
In 2012, natural gas accounted for 42 percent of the total
Dutch primary energy use. Holland uses approximately 40
billion cubic meter (BCM) natural gas per year. In addition,
another 40 (BCM) is being exported to other European
countries. This consequently gives natural gas an important
economical value for Holland (source: Aardgas in
Nederland).
However, there are side effects to gas drilling as well. Gas
occupies a certain amount of space in the ground. When it
is being extracted the ground may sink a bit, with small
magnitude earthquakes as a result.
In Groningen, the most north-eastern province of The
Netherlands, a noticeable natural gas field is situated:
natural gas is commonly found in porous lithical layers,
often in early deposited sand stone. These subsoil layers are
found in Groningen. But since 2013 the earthquakes caused
by gas extraction have increased observably, which induced
damage to several villages. However, a large part of the
Groninger gas field is situated underneath the protected
Natura 2000 natural areas. Most likely gas drilling will
continue (as shown in the graph underneath). This might
have a negative effect on the nature reserves.
Julia van Middelaar & Lieke Moonen
Course Digital Earth I Year 2014
Methods (Continuing)
- AardGeoCl1.tif
Derived from “Gasbevingen Portaal”. Used the Snipping Tool
to capture the province Groningen, then the figure was
added as Shapefile. Thereafter, we Georeferenced the figure
and then we clipped the figure by using the
GroningenProvincieClip as Output Extent.
- GasClip
Derived from the NL Oil and Gas Portal. Used the Snipping
Tool to capture the province Groningen, then the figure was
added as Shapefile. Thereafter, we Georeferenced the figure
and then we clipped the figure by using the
GroningenProvincieClip as Output Extent
- GroningenProvincieClip
Derived from “Geografische open-data GIS bestanden”,
added as an Shapefile. We clipped the province Groningen,
so we could use the layer as Output Extent by clipping the
other maps.
- GeologieMapClip
Derived from “TNO Kennis voor zaken”, added as an WMS
file by using the WMS Server. Thereafter, we clipped the
figure by using the GroningenProvincieClip as Output
Extent.
Results and Conclusion
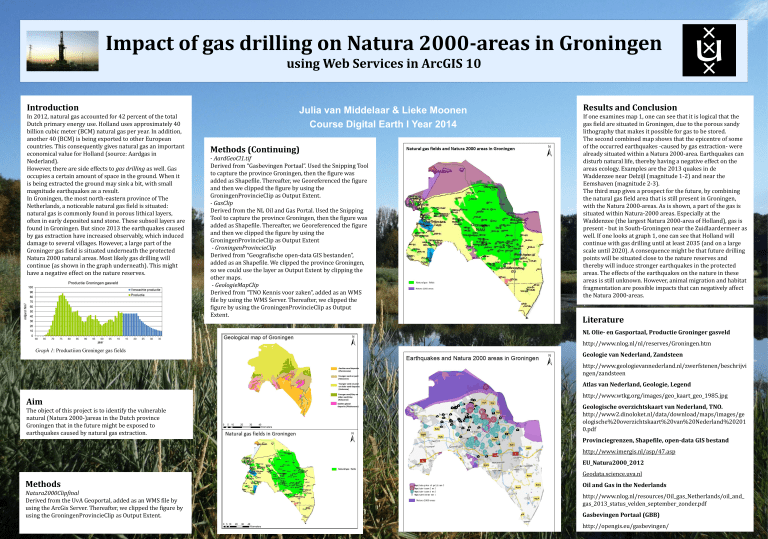
If one examines map 1, one can see that it is logical that the
gas field are situated in Groningen, due to the porous sandy
lithography that makes it possible for gas to be stored.
The second combined map shows that the epicentre of some
of the occurred earthquakes -caused by gas extraction- were
already situated within a Natura 2000-area. Earthquakes can
disturb natural life, thereby having a negative effect on the
areas ecology. Examples are the 2013 quakes in de
Waddenzee near Delzijl (magnitude 1-2) and near the
Eemshaven (magnitude 2-3).
The third map gives a prospect for the future, by combining
the natural gas field area that is still present in Groningen,
with the Natura 2000-areas. As is shown, a part of the gas is
situated within Natura-2000 areas. Especially at the
Waddenzee (the largest Natura 2000-area of Holland), gas is
present - but in South-Groningen near the Zuidlaardermeer as
well. If one looks at graph 1, one can see that Holland will
continue with gas drilling until at least 2035 (and on a large
scale until 2020). A consequence might be that future drilling
points will be situated close to the nature reserves and
thereby will induce stronger earthquakes in the protected
areas. The effects of the earthquakes on the nature in these
areas is still unknown. However, animal migration and habitat
fragmentation are possible impacts that can negatively affect
the Natura 2000-areas.
Literature
NL Olie- en Gasportaal, Productie Groninger gasveld
http://www.nlog.nl/nl/reserves/Groningen.htm
Graph 1: Productiion Groninger gas fields
Geologie van Nederland, Zandsteen
http://www.geologievannederland.nl/zwerfstenen/beschrijvi
ngen/zandsteen
Atlas van Nederland, Geologie, Legend
Aim
The object of this project is to identify the vulnerable
natural (Natura 2000-)areas in the Dutch province
Groningen that in the future might be exposed to
earthquakes caused by natural gas extraction.
http://www.wtkg.org/images/geo_kaart_geo_1985.jpg
Geologische overzichtskaart van Nederland, TNO.
http://www2.dinoloket.nl/data/download/maps/images/ge
ologische%20overzichtskaart%20van%20Nederland%20201
0.pdf
Provinciegrenzen, Shapefile, open-data GIS bestand
http://www.imergis.nl/asp/47.asp
EU_Natura2000_2012
Geodata.science.uva.nl
Methods
Natura2000Clipfinal
Derived from the UvA Geoportal, added as an WMS file by
using the ArcGis Server. Thereafter, we clipped the figure by
using the GroningenProvincieClip as Output Extent.
Oil and Gas in the Nederlands
http://www.nlog.nl/resources/Oil_gas_Netherlands/oil_and_
gas_2013_status_velden_september_zonder.pdf
Gasbevingen Portaal (GBB)
http://opengis.eu/gasbevingen/


