Bijlage B: Berekenen scenario's en plotten resultaten
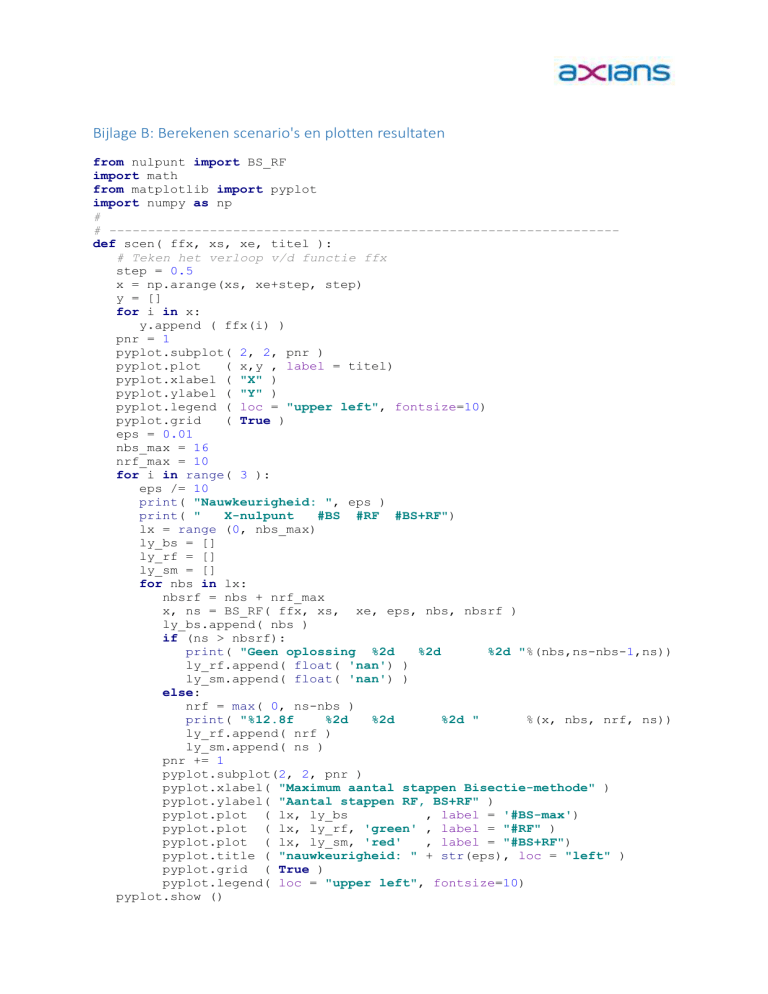
from nulpunt import BS_RF
import math
from matplotlib import pyplot
import numpy as np
#
# -----------------------------------------------------------------def scen( ffx, xs, xe, titel ):
# Teken het verloop v/d functie ffx
step = 0.5
x = np.arange(xs, xe+step, step)
y = []
for i in x:
y.append ( ffx(i) )
pnr = 1
pyplot.subplot( 2, 2, pnr )
pyplot.plot
( x,y , label = titel)
pyplot.xlabel ( "X" )
pyplot.ylabel ( "Y" )
pyplot.legend ( loc = "upper left", fontsize=10)
pyplot.grid
( True )
eps = 0.01
nbs_max = 16
nrf_max = 10
for i in range( 3 ):
eps /= 10
print( "Nauwkeurigheid: ", eps )
print( "
X-nulpunt
#BS #RF #BS+RF")
lx = range (0, nbs_max)
ly_bs = []
ly_rf = []
ly_sm = []
for nbs in lx:
nbsrf = nbs + nrf_max
x, ns = BS_RF( ffx, xs, xe, eps, nbs, nbsrf )
ly_bs.append( nbs )
if (ns > nbsrf):
print( "Geen oplossing %2d
%2d
%2d "%(nbs,ns-nbs-1,ns))
ly_rf.append( float( 'nan') )
ly_sm.append( float( 'nan') )
else:
nrf = max( 0, ns-nbs )
print( "%12.8f
%2d
%2d
%2d "
%(x, nbs, nrf, ns))
ly_rf.append( nrf )
ly_sm.append( ns )
pnr += 1
pyplot.subplot(2, 2, pnr )
pyplot.xlabel( "Maximum aantal stappen Bisectie-methode" )
pyplot.ylabel( "Aantal stappen RF, BS+RF" )
pyplot.plot ( lx, ly_bs
, label = '#BS-max')
pyplot.plot ( lx, ly_rf, 'green' , label = "#RF" )
pyplot.plot ( lx, ly_sm, 'red'
, label = "#BS+RF")
pyplot.title ( "nauwkeurigheid: " + str(eps), loc = "left" )
pyplot.grid ( True )
pyplot.legend( loc = "upper left", fontsize=10)
pyplot.show ()
#
# -----------------------------------------------------------------def fxx (x):
return (2*x + b)*x + -5
xs = 0.0
xe = 10.0
scen( fxx, xs, xe, "Y = 2X**2 + X – 5" )
#
# -----------------------------------------------------------------def fx (x):
return 10*math.log(x) - 10
xs = 1.0
xe = 10.0
scen( fx, xs, xe, "y = 10*math.log(x) - 10" )
