Bruto Binnenlands Product
Stichting Planbureau Suriname
2014
Tabellen
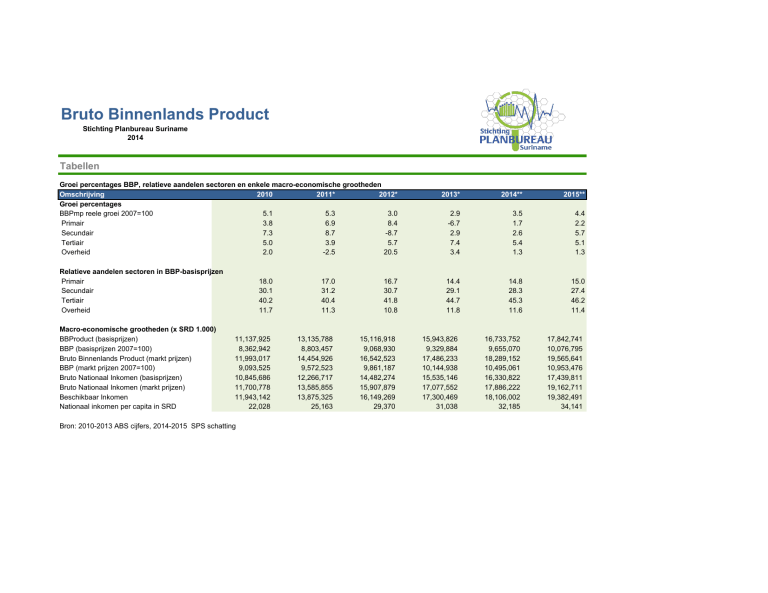
Groei percentages BBP, relatieve aandelen sectoren en enkele macro-economische grootheden
Omschrijving
2010
2011*
2012*
Groei percentages
BBPmp reele groei 2007=100
5.1
5.3
3.0
Primair
3.8
6.9
8.4
Secundair
7.3
8.7
-8.7
Tertiair
5.0
3.9
5.7
Overheid
2.0
-2.5
20.5
Relatieve aandelen sectoren in BBP-basisprijzen
Primair
Secundair
Tertiair
Overheid
Macro-economische grootheden (x SRD 1.000)
BBProduct (basisprijzen)
BBP (basisprijzen 2007=100)
Bruto Binnenlands Product (markt prijzen)
BBP (markt prijzen 2007=100)
Bruto Nationaal Inkomen (basisprijzen)
Bruto Nationaal Inkomen (markt prijzen)
Beschikbaar Inkomen
Nationaal inkomen per capita in SRD
18.0
30.1
40.2
11.7
11,137,925
8,362,942
11,993,017
9,093,525
10,845,686
11,700,778
11,943,142
22,028
Bron: 2010-2013 ABS cijfers, 2014-2015 SPS schatting
17.0
31.2
40.4
11.3
13,135,788
8,803,457
14,454,926
9,572,523
12,266,717
13,585,855
13,875,325
25,163
16.7
30.7
41.8
10.8
15,116,918
9,068,930
16,542,523
9,861,187
14,482,274
15,907,879
16,149,269
29,370
2013*
2014**
2015**
2.9
-6.7
2.9
7.4
3.4
3.5
1.7
2.6
5.4
1.3
4.4
2.2
5.7
5.1
1.3
14.4
29.1
44.7
11.8
14.8
28.3
45.3
11.6
15.0
27.4
46.2
11.4
15,943,826
9,329,884
17,486,233
10,144,938
15,535,146
17,077,552
17,300,469
31,038
16,733,752
9,655,070
18,289,152
10,495,061
16,330,822
17,886,222
18,106,002
32,185
17,842,741
10,076,795
19,565,641
10,953,476
17,439,811
19,162,711
19,382,491
34,141
Aandeel per sector in BBP
basisprijzen
Bedrijven en Huishoudens
Landbouw,Veeteelt en Bosbouw
Visserij
Mijnbouw
Industrie/Fabricage
Electriciteit,Gas en Water
Constructie
Handel
Hotels en Restaurants
Transport, Opslag en Communicatie
Financiële Instellingen
Zakelijke diensten
Onderwijs
Gezondheidszorg
Ov. Gem.- , Soc. en Pers. Die
Sector Overheid
Landbouw,Veeteelt en Bosbouw
Electriciteit, Gas en Water
Constructie
Transport, Opslag en Communicatie
Public administration
Onderwijs
Gezondheidszorg
BBP tegen basisprijzen
2011*
6.8
2.9
7.4
22.9
2.0
6.3
20.4
3.1
6.4
5.6
3.5
0.1
0.6
0.7
2012*
6.6
2.5
7.6
23.1
2.0
5.5
20.4
3.3
7.5
6.0
3.3
0.1
0.6
0.7
2013*
5.8
2.8
5.8
20.7
2.2
6.2
22.0
3.4
7.9
6.4
3.4
0.1
0.7
0.8
2014**
6.2
3.4
5.2
19.6
2.1
6.6
20.7
3.6
8.2
7.8
3.4
0.1
0.7
0.8
2015**
6.5
3.9
4.6
18.8
2.1
6.6
19.9
3.7
8.4
9.1
3.4
0.1
0.7
0.8
0.2
0.1
0.1
0.2
4.6
3.5
2.6
100.0
0.2
0.1
0.1
0.2
4.3
3.3
2.6
100.0
0.2
0.1
0.1
0.2
4.5
3.7
3.0
100.0
0.2
0.1
0.1
0.2
4.3
3.7
3.0
100.0
0.2
0.1
0.1
0.2
4.3
3.6
3.0
100
Reele groeicijfer per sector (2007 = 100)
Bedrijven en Huishoudens
2010
Landbouw,Veeteelt en Bosbouw
1.5
Visserij
6.8
Mijnbouw
5.2
Industrie/fabricage
12.0
Electriciteit,Gas en Water
0.2
Constructie
-9.8
Handel
4.5
Hotels en Restaurants
20.3
Transport, Opslag en Communicatie
4.8
Financiële Instellingen
6.2
Zakelijke diensten
-2.4
Onderwijs
2.0
Gezondheidszorg
-2.0
Ov. Gem. , Soc. en Pers.
-2.3
Subtotaal
5.5
Sector Overheid
Landbouw,Veeteelt en Bosbouw
1.2
Electriciteit, Gas en Water
36.3
Constructie
9.3
Transport, Opslag en Communicatie
-23.0
Public administration
1.9
Onderwijs
2.3
Gezondheidszorg
3.5
Subtotaal
2.0
BBP tegen basisprijzen
5.1
Indirecte bel. minus subsidies op prod. en importen5.1
BBP tegen marktprijzen
5.1
2011*
4.6
4.0
11.3
7.6
15.0
11.7
2.9
3.4
4.3
7.6
2.9
4.6
1.6
6.3
6.2
2012*
13.9
1.2
5.3
-13.5
1.1
11.8
5.0
4.8
4.9
11.0
3.3
1.9
4.6
6.3
1.2
2013*
-15.6
9.0
-2.4
1.3
2.2
9.4
5.0
8.1
7.8
17.5
3.0
-4.5
1.9
6.3
2.8
2014**
3.7
3.3
-1.5
1.5
2.0
6.8
5.4
7.4
4.9
6.7
2.7
1.0
2.0
6.3
3.8
2015**
4.6
4.1
-1.7
6.1
2.0
5.6
5.1
7.0
4.5
6.3
2.8
1.0
2.0
6.3
4.7
-5.5
-3.4
-9.4
4.0
0.5
-2.3
-7.7
-2.5
5.3
5.3
5.3
2.6
34.1
-24.3
-12.2
45.3
1.9
4.6
20.5
3.0
3.0
3.0
6.5
11.8
-27.9
4.9
7.7
-4.5
1.9
3.4
2.9
2.9
2.9
2.6
3.1
1.0
5.0
1.0
1.0
2.0
1.3
3.5
3.1
3.5
2.6
3.1
1.0
5.0
1.0
1.0
2.0
1.3
4.4
4.4
4.4
Bruto Binnenlands Product
Stichting Planbureau Suriname
2014
Tabellen
GDP mp current prices 2010-2015
Bron : SPS, september 2014
GDP per Capita 2011-2015 in SRD
Bron: SPS, september 2014
* voorlopige cijfers ABS, ** voorlopige schattingen SPS
Contribution to growth per sector 2011-2015
Bron: SPS, september 2014
